

January canola futures have declined by around 8% since early December 2025 after StatCan’s December estimate reflected a sudden increase to a record-high Canada canola crop, surprising the market and putting downward pressure on prices.
Octopusbot’s AI-driven models continue to point to a lower production since May 2025. Satellite data and seasonal weather conditions captured by the models do not support yields of this magnitude. Dry conditions during May–June and high temperatures in July impacted yields negatively, keeping Octopusbot’s production estimate at 19.1MT, well below StatCan’s latest estimate of 22MT.
In this analysis, we examine how Octopusbot identified this lower production trajectory early in the season, why StatCan’s December estimate appears inflated, and the key drivers supporting a lower yield and production outlook.
Understanding Revisions to StatCan’s December Canola Estimates
StatCan’s canola estimates rely primarily on NDVI data and field crop surveys, which provide an indication of crop health but do not fully capture changing field conditions through the season that ultimately impact final production.
Historically, StatCan’s December canola estimates have required revisions once harvest outcomes and receivals data become available in January.
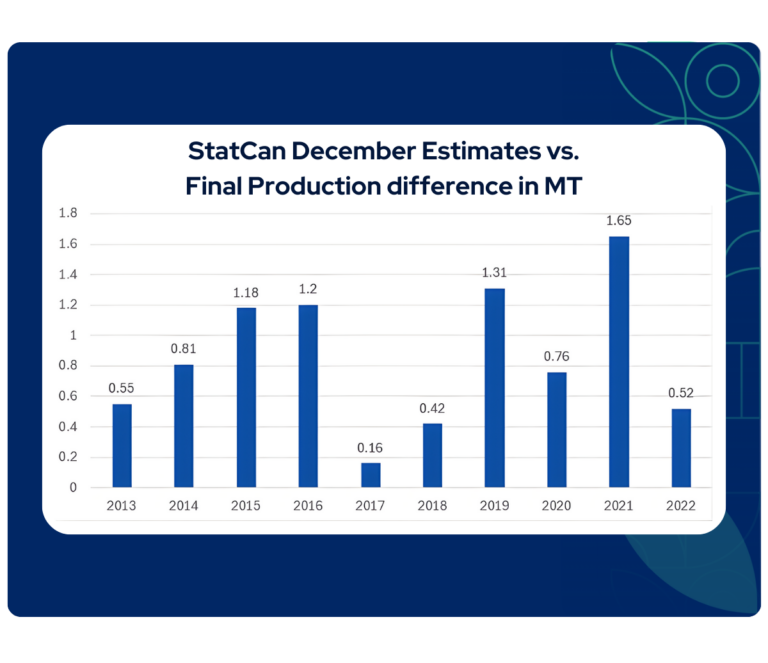
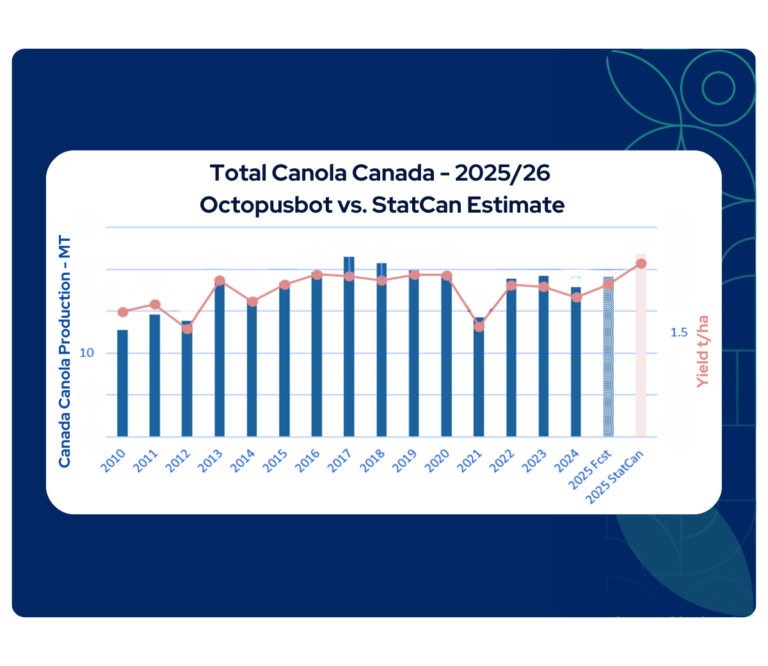
As shown in the chart above, the difference between final production and StatCan’s December estimate from 2013 to 2022 has predominantly resulted in upward revisions, reflecting adjustments made after harvest data is incorporated.
In the current season, based on Octopusbot’s data-grounded assessment of field conditions and seasonal biomass, the record yields implied by StatCan’s estimate are not supported. As a result, Octopusbot anticipates that StatCan’s December figure is overstated, increasing the likelihood of a downward revision once final production data becomes available.
NDVI Data Does Not Support Record Canola Yields
Accumulated NDVI across Canada’s main canola growing regions, including Saskatchewan, Manitoba, and Alberta, indicates a stronger crop compared to last season, but not at levels associated with record yield outcomes.
As shown in the charts below, accumulated NDVI for the 2025/26 season is higher than last year in Saskatchewan, slightly higher in Manitoba, and broadly in line with last year in Alberta. In each chart, the current season is represented by the red line, while the grey shaded area shows the historical range of accumulated NDVI outcomes.
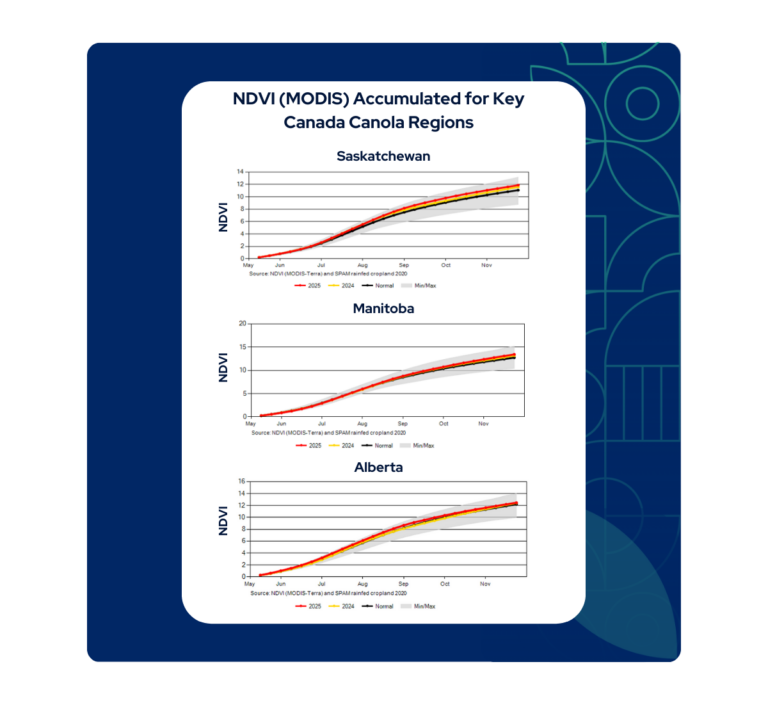
Across all three regions, the red line remains within the historical spread and does not reach the upper bound of the grey area, indicating that seasonal biomass accumulation has been solid but not exceptional. If yields were tracking toward record levels, accumulated NDVI would be expected to sit near the historical maximum across key growing regions, which is not observed in the current season.
As a result, satellite data does not support the record yields implied by StatCan’s December estimate, reinforcing a lower yield and production outlook.
Unfavourable Early Season Dryness Limited Yield Potential
Early season weather conditions across Canada’s main canola growing regions were unfavourable and constrained yield potential for the season. Dry conditions during May and June, followed by brief heat events during canola flowering in July, limited the potential for record yields.
In May, rainfall was 75% of the median, resulting in soil moisture levels at 85% of the median, ranking #20 of the last 24 years. Soil moisture deficits persisted into June, with rainfall at 87% of the median and soil moisture at 86% of the median across key growing regions.
In July, canola growing regions recorded brief heat events, with 0.7 days above 32°C during the flowering period. While this was lower than the record 5.8 days above 32°C in 2021, high temperatures during flowering weighed on yield potential.
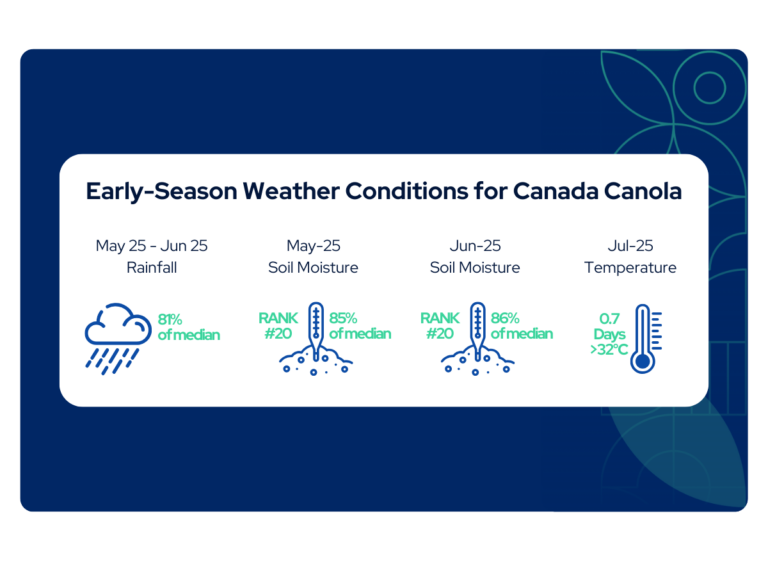
Overall, early season soil moisture deficits combined with high temperatures during canola flowering do not support the record yields implied by StatCan’s latest estimate, reinforcing production closer to Octopusbot’s lower estimate.
Octopusbot’s Latest Canada Canola Estimate
Octopusbot’s latest estimate for Canada’s canola production, released in November, stands at 19.1MT. While this represented a slight upward revision from the previous estimate by Octopusbot, production remains 13.2% below StatCan’s latest estimate of 22MT, which exceeds the previous production record of 21.3MT set in 2017.
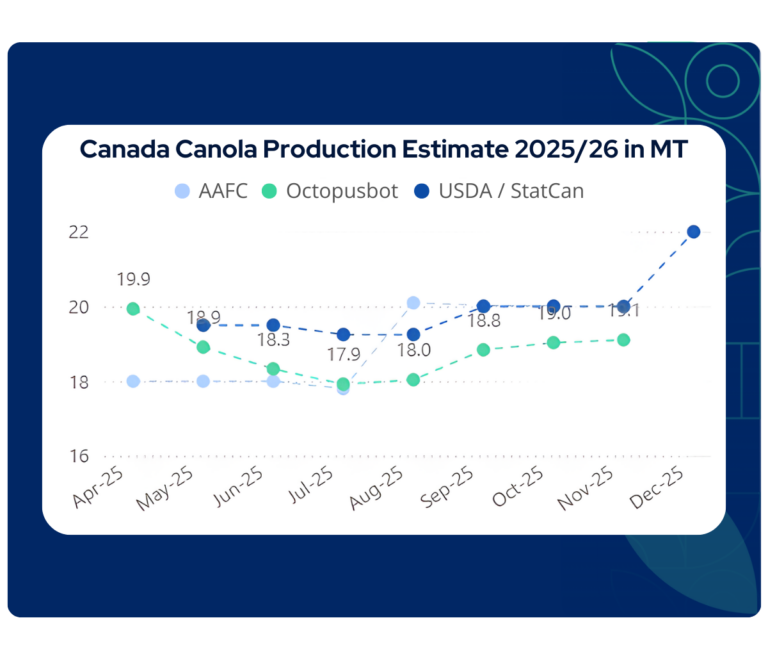
Octopusbot’s AI-driven models combine hundreds of weather parameters with satellite data and historical yield data at regional level to produce accurate estimates for the season. Since May 2025, these models have captured the impact of early season dryness and high temperatures, which constrained yield potential across key growing regions. These field realities are not fully reflected in StatCan’s latest estimate, contributing to the divergence between official projections and Octopusbot’s production outlook.
The key drivers impacting Octopusbot’s latest estimate for Canada’s canola production are:
- Planted Area: Canola planted area is estimated 1.8% lower than last year, based on the latest Statistics Canada data.
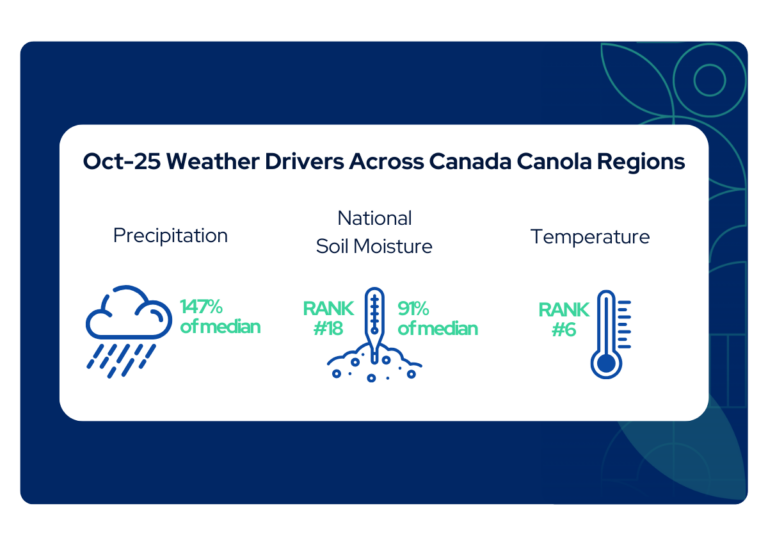
- Precipitation: October 2025 rainfall recorded 147% of the median, with above-median rainfall in Manitoba and Saskatchewan and near-median rainfall in Alberta.
- Soil Moisture: In October 2025, soil moisture remained below the median in Alberta and Saskatchewan, while Manitoba recorded near-median levels. Nationally, soil moisture was 91% of the median.
- Temperatures: October 2025 temperatures in Manitoba ranked #1 of the last 24 years. Nationally, temperatures were ranked #6 of the last 24 years recording 101% of the median.
Comparative Yield Assessment Driving the Divergence in Production Estimates
While Octopusbot projects Canada’s canola yield to be 7% higher than last season, in-season weather conditions and satellite indicators do not support the record yields implied by StatCan’s production estimate.
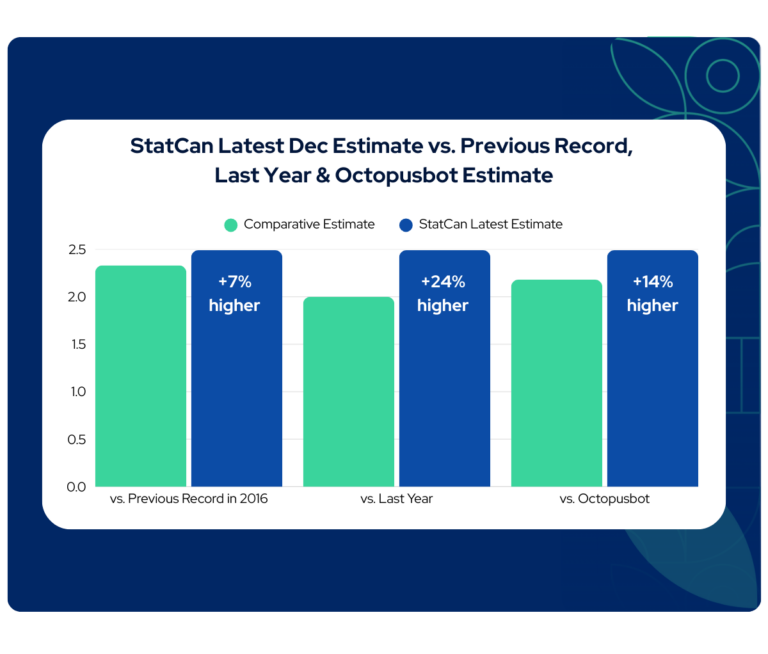
The yields implied by StatCan’s record production estimate are materially higher, sitting 7% above the previous record achieved in 2016, 24% above last season, and 14% above Octopusbot’s latest yield estimate.
Satellite data, including Sentinel-2 and MODIS, do not show the seasonal biomass required to support yields of this magnitude. Early season dry conditions, followed by high temperatures during canola flowering, constrained yield potential earlier in the season. Widespread rainfall only occurred in August, by which time it was already the start of harvest in parts of the Prairies, limiting its impact on final yields.
As a result, the divergence between Octopusbot and StatCan remains yield-driven, with Octopusbot’s AI-driven models supporting yields above last year but not at record levels.
Octopusbot Past Forecast Accuracy
Canada canola prices declined in December as markets reacted to StatCan’s record production estimate. However, Octopusbot’s data-driven assessment does not support a record crop, with AI models examining seasonal biomass across key canola-growing regions and in-season weather conditions, both of which do not support the record yields implied by StatCan’s estimate.
Since May 2025, Octopusbot’s models have consistently projected Canada’s canola production below official estimates, providing market participants with early directional insight by capturing early season dry conditions and high temperatures that impacted yields negatively across key growing regions. This ability to accurately forecast production outcomes early in the season has been evident across past seasons, enabling traders, brokers, and agribusinesses to mitigate risks, maximise profits, and make smarter data-driven decisions.
In April 2024, Octopusbot predicted within 95% accuracy range, that the season’s production would trend lower than the USDA, 7 months before the final estimate and 1 month before USDA, with a difference of 2.7% on the final estimate.

 For full, detailed AI forecasts on Canada wheat, barley & canola:
Comments are closed