

Octopusbot’s New Feature, Crop Emergence Tracker is Now Live: A Step-by-Step Guide
Stay Ahead When You Trade: Introducing Octopusbot’s Crop Emergence Tracker
In grain markets, early signals matter. That’s why we have built a brand-new tool to help you track the season from the moment it begins.
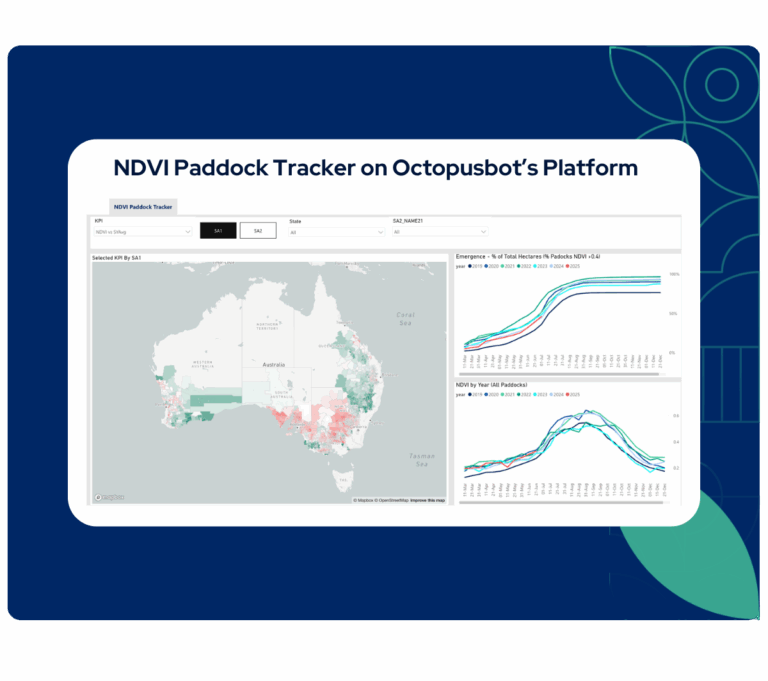
Our Crop Emergence Tracker is now live. Using NDVI satellite data updated every 10 days, this tool helps you monitor crop emergence across 1.5 million paddocks in Australia, making it one of the most comprehensive early-season monitoring tools available.
What Is NDVI and How Are We Using It?
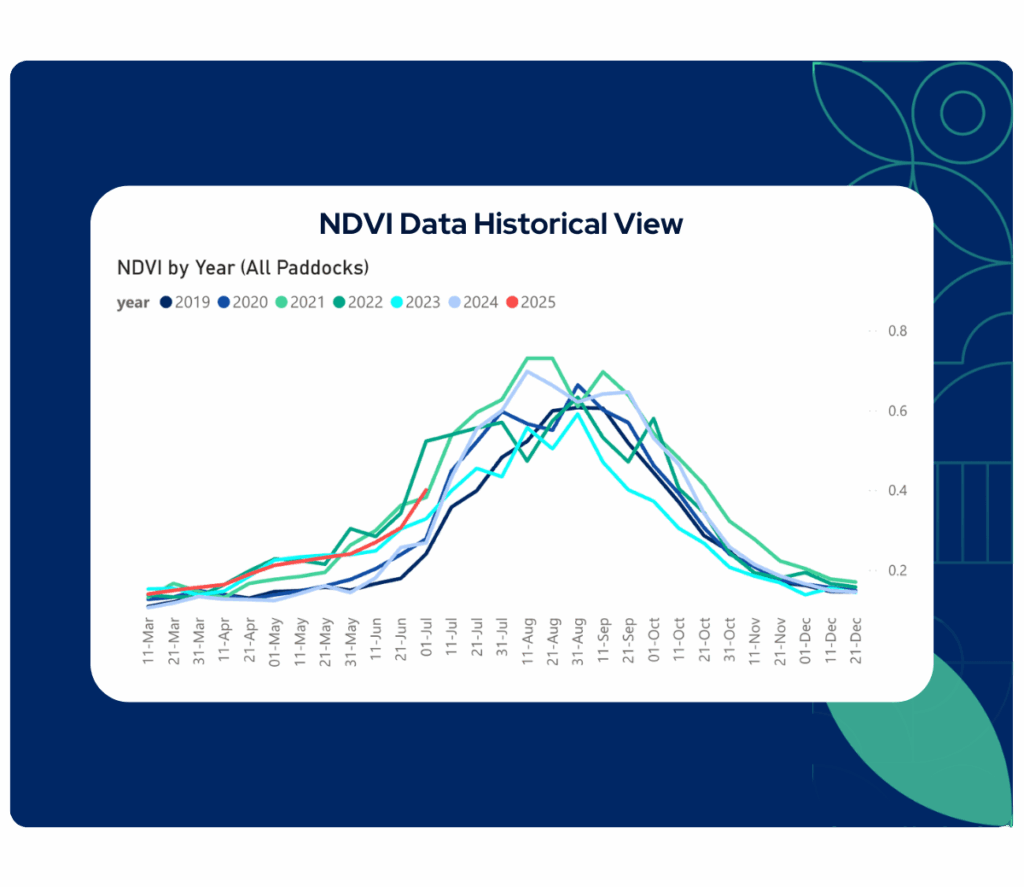
NDVI (Normalized Difference Vegetation Index) measures the greenness of vegetation from satellite imagery. In practical terms, it tells us when crops start to emerge.
We collect NDVI data for every paddock in the country and refresh it every 10 days. While we can drill down to individual paddocks, we aggregate data at the SA1 and SA2 regional levels to provide insights that are both scalable and actionable.
Identifying Crop Emergence
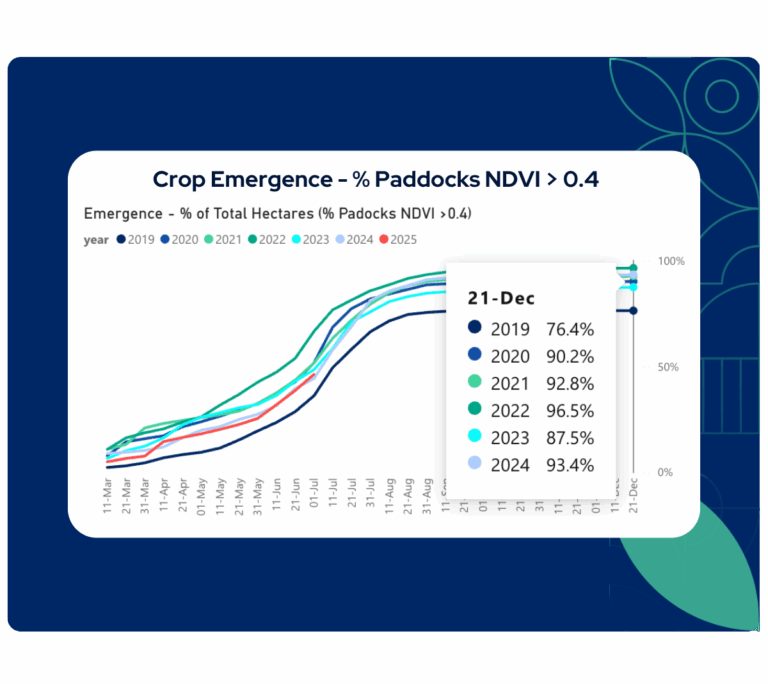
To determine emergence, we track how many paddocks in a region exceed an NDVI value of 0.4 – a widely accepted benchmark for early crop growth. This allows you to easily see how many paddocks have reached emergence in your region or compare progress across different zones.
Regional View: Navigate and Compare Crop Emergence Across Australia
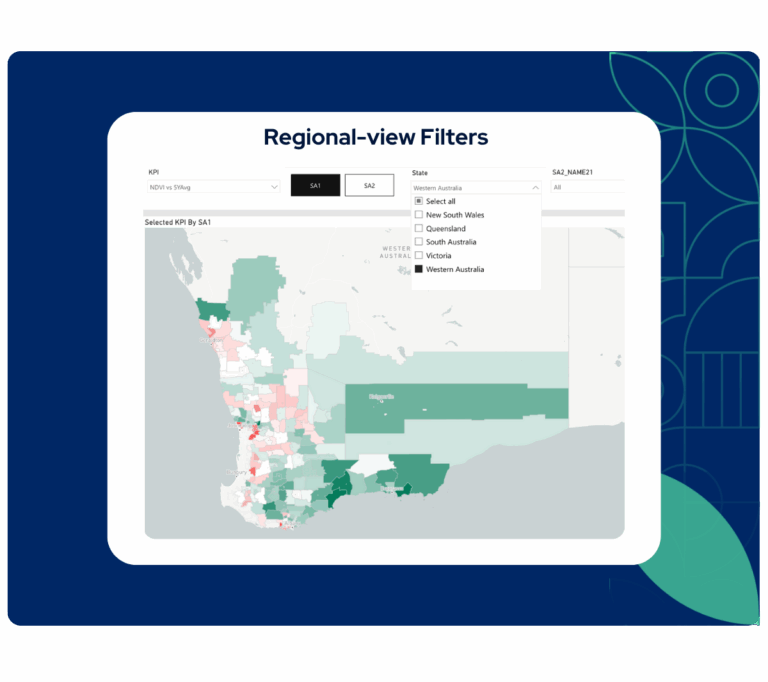
Our Crop Emergence Tracker lets you track planting progress across Australia’s key growing regions. With intuitive filters and region-level breakdowns, you can quickly:
- Select specific regions (e.g., New South Wales, Western Australia)
- View how many paddocks have passed the 0.4 NDVI threshold
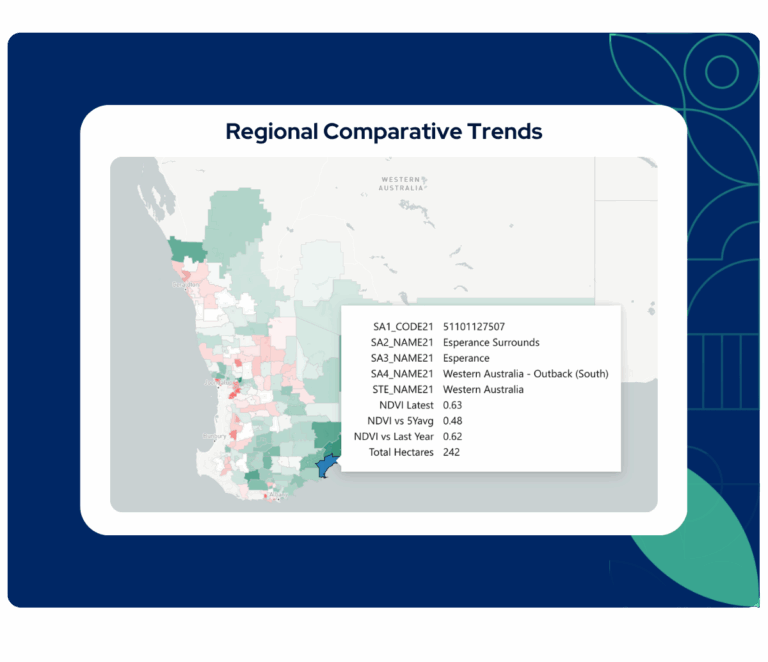
- Compare crop emergence trends between different regions within states
- Identify early vs. delayed planting areas
You can also zoom into smaller statistical regions (SA1 and SA2) to spot differences at a more granular level. This level of visibility helps you monitor planting progress in real-time, benchmark performance across seasons, and adjust your strategies early – region by region.
Complete Historical View, Updated Every 10 Days
The Crop Emergence Tracker is not just about today. We have compiled NDVI data right through to December 31st, giving you a full picture of how each season progressed, allowing you to benchmark performance year-on-year.
With updates every 10 days, you are always equipped with the latest data to make confident decisions.
Know Before You Grow with Octopusbot
By providing early signals of emergence, the Crop Emergence Tracker empowers you to:
- Maximize profits with accuracy
- Mitigate risks with confidence
- Make smarter, data-driven decisions
- Stay informed with local & global data
Try for Free & Get Access to the Crop Emergence Feature and Many More!
With the Crop Emergence Tracker now live, you can start monitoring early-season crop health like never before.
👉 If you are already a Farm AI Forecasts Customer or exploring Octopusbot on a free trial, log in to your Octopusbot dashboard and get started.
Comments are closed