

US corn yields are at the centre of debate, with USDA maintaining a record-high outlook even as late-season pressures intensify. Octopusbot’s AI-driven forecasts, informed by newly emerging factors such as intensified August dryness, widespread fungal outbreaks in the Corn Belt and Southern rust spread to Midwest, point instead to lower yield potential. Octopusbot’s lower corn yield estimate is reinforced by Pro Farmer’s crop tour, which also highlighted downside risks with figures below USDA’s outlook. Taken together, these indicators present a compelling case for caution and reinforce why Octopusbot’s forecasts provide a more accurate, data-driven estimate of US corn production this season.
USDA Maintains Record-Level Estimates Despite Revision
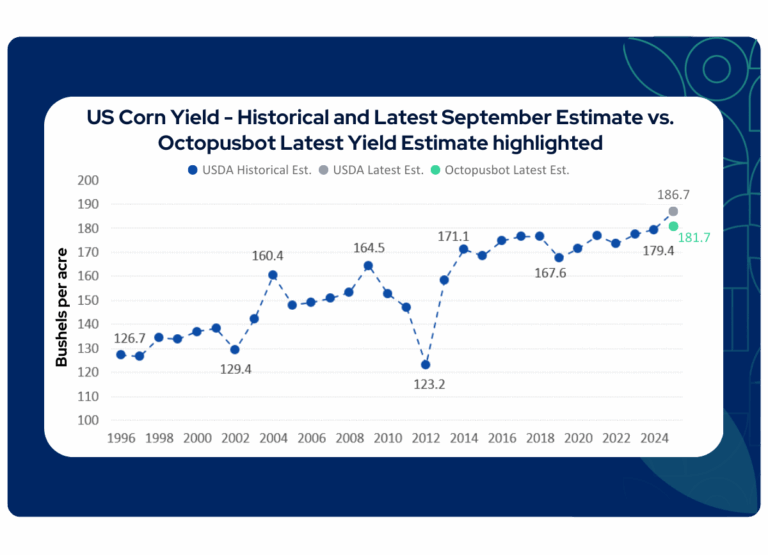
USDA’s latest corn yield forecasts continue to reflect optimism, even as signs of crop stress build. In August 2025, USDA projected a record 188.8 bushels/acre, before revising the figure to 186.7 bushels/acre in September, a reduction of 2.1 bushels in just one month. Even after this revision, the outlook remains well above the previous record (4% above the previous 179.4 bushels/acre) and Octopusbot’s estimate, indicating that USDA’s estimates are still overstated relative to conditions observed in the field.
Understanding the Gap in USDA’s Approach
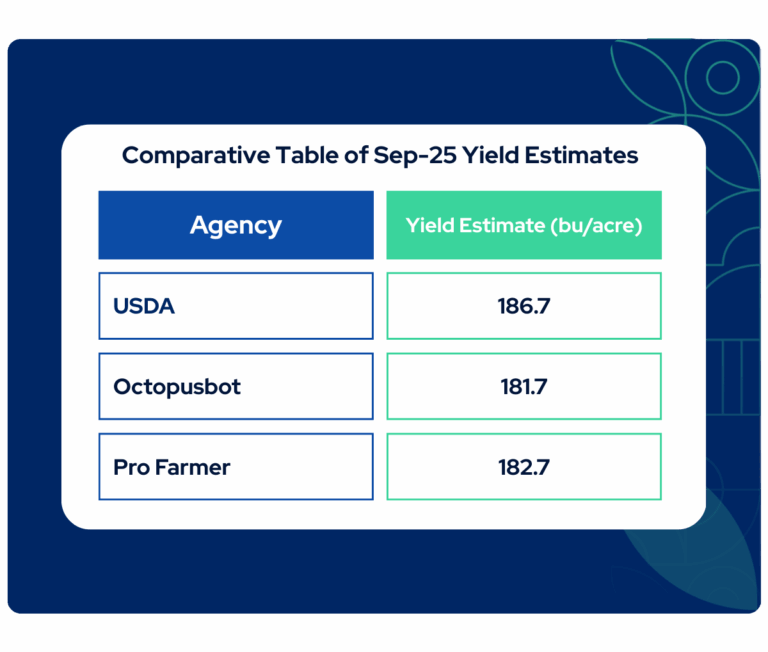
USDA’s estimate points to a record-high US corn yield of 186.7 bushels/acre, but Octopusbot’s assessment shows that this figure is not fully supported by the underlying indicators. Our current forecast stands at 181.7 bushels/acre, about 2.7% lower than USDA, reflecting a more data-driven assessment of late-season crop conditions.
A key reason for the difference is USDA’s reliance on NDVI data, which signalled strong vegetation across much of the Corn Belt. While NDVI is a valuable tool for monitoring crop greenness, it does not capture kernel weight, subsoil moisture depletion, or late-season stress factors such as August dryness. Taken in isolation, NDVI can therefore present an incomplete picture and often overstate actual yield potential.
Octopusbot’s forecasts combine NDVI with high-resolution weather and historical yield data at the county level, providing a more accurate representation of actual crop conditions. Reinforcing Octopusbot’s findings, Pro Farmer’s crop tour estimated the US corn yield at 182.7 bushels/acre, about 2.1% lower than USDA’s latest September estimate. The alignment between model-driven forecasts and field-based assessments strengthens the case for a downward adjustment in USDA’s outlook.
Field Realities Shaping the 2025 Corn Crop
Earlier in the season, wet and humid conditions across the Corn Belt, with June and July rainfall reaching more than 130% of the median, created a favourable environment for fungal outbreaks such as tar spot and gray leaf spot, reducing overall plant health. As the crop progressed, southern rust spread more aggressively into Illinois, Iowa, and Nebraska, weakening the crop during grain fill.
August compounded these pressures with extreme dryness across core producing states. Kentucky (28% of median), Tennessee (38% of median), and Ohio (41% of median) each recorded some of the lowest August rainfall in history. Nationally, precipitation averaged 2.30 inches, which is 0.32 inches below the long-term average, leaving soils critically depleted during the grain-fill period. These conditions constrained kernel development, negatively impacting the yields.
Persistent dryness along the Mississippi River marks the 4th consecutive year of low water levels during harvest, disrupting barge traffic and slowing grain flows out of the Midwest. Coupled with depleted soil moisture, these conditions add further pressure on yield outcomes and market flow.
Octopusbot Corn Production Estimate
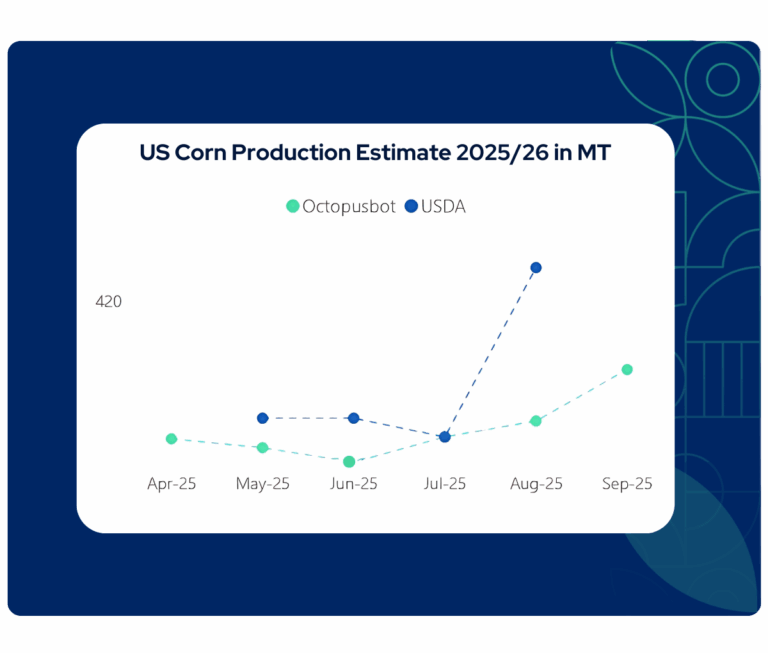
Octopusbot’s latest estimate for US corn production has increased compared to the previous update, largely driven by higher planted areas. However, the forecast remains below USDA’s record estimate as low rainfall and dryness weighed on yields. Yields increased in the West, South, Northeast, and West North Central, but declined in the Midwest. Octopusbot’s hundreds of interconnected models, combining weather parameters and regional crop conditions, show how these shifts, particularly the Midwest downturn, are driving a lower estimate than USDA’s projections.
The key drivers impacting US corn production are:
- Planted Area: U.S. corn planted area increased 6.5% year-on-year.
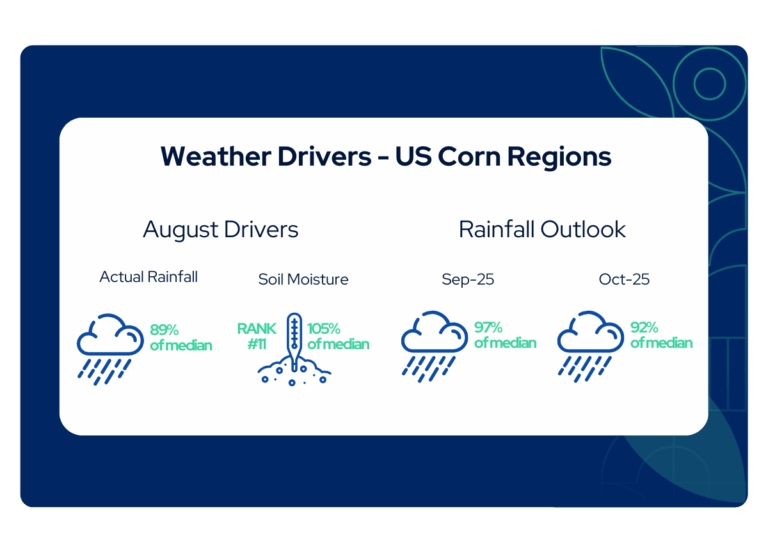
- Precipitation: August 2025 recorded lower-than-forecast rainfall (89% vs. 100% of the median forecast).
- Soil Moisture: Soil moisture ranking dropped from rank #5 to #11 of the last 24 years. Severe deficits were observed in Kentucky, Tennessee, Arkansas, Mississippi, and Missouri.
- Outlook: September 2025 rainfall is forecast at 97% of the median, while October has been revised down to 92% of the median.
Octopusbot’s Forecast Accuracy
The gap between USDA’s record corn forecast and Octopusbot’s latest estimate reflects more than just numbers. It highlights the role of weather-driven modelling in capturing risks that emerge during the most critical stages of the season.
Octopusbot’s models capture the impact of late-season conditions more accurately than traditional forecasts, helping market participants anticipate production shifts early in the season. For farmers, agribusinesses, brokers, and traders, this helps to maximize profits with accuracy, mitigate risks with confidence, make smarter data-driven decisions, and stay informed with regional and global coverage.
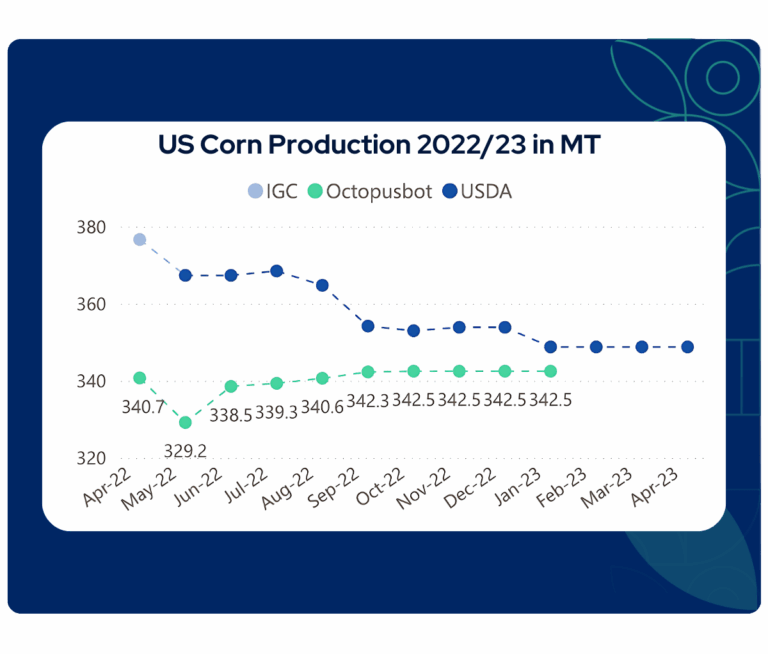
In April 2022, Octopusbot predicted that the season’s production would trend lower for US corn, 9 months ahead of the USDA’s prediction with a difference of only 1.8% in the final estimate.
Comments are closed