

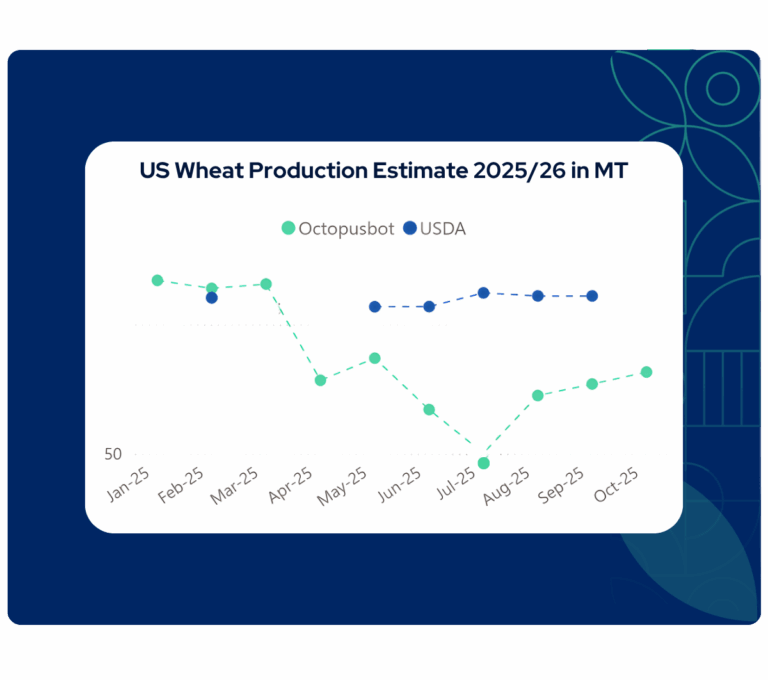
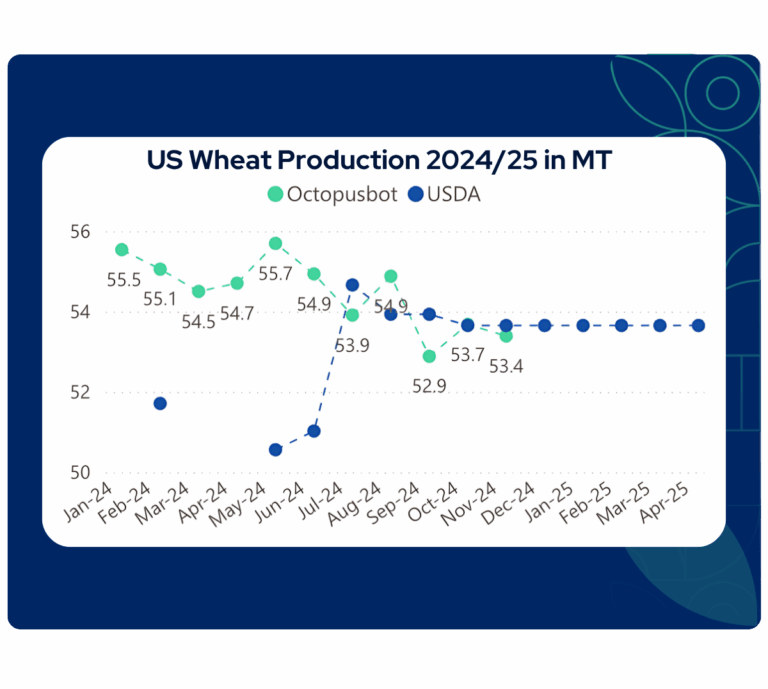
USDA’s latest Small Grains Summary report places total U.S. wheat production at 54 MT, which is significantly higher than Octopusbot’s forecast, marking the widest gap between the two estimates in 3 years.
This difference is driven by the near-record winter wheat yield reported by USDA, which is the highest since 2016 and the second highest on record. However, NDVI signals, crop condition scores, and Octopusbot’s weather-based models do not support yields of this magnitude.
In this analysis, we will explore the reasons behind this divergence and what the underlying data reveals about the true production potential for the 2025/26 U.S. winter wheat season.
A Growing Divergence in Winter Wheat Estimates
USDA’s September 2025 Small Grains Summary report places total U.S. wheat production 5.5% above Octopusbot’s estimate, marking the widest difference in 3 years. In comparison, the variation between the two estimates was only 0.6% in 2024, highlighting the unusual scale of this year’s gap. The main driver of this difference lies in winter wheat, where USDA reports yield at near-record levels which is not supported by Octopusbot’s weather models.
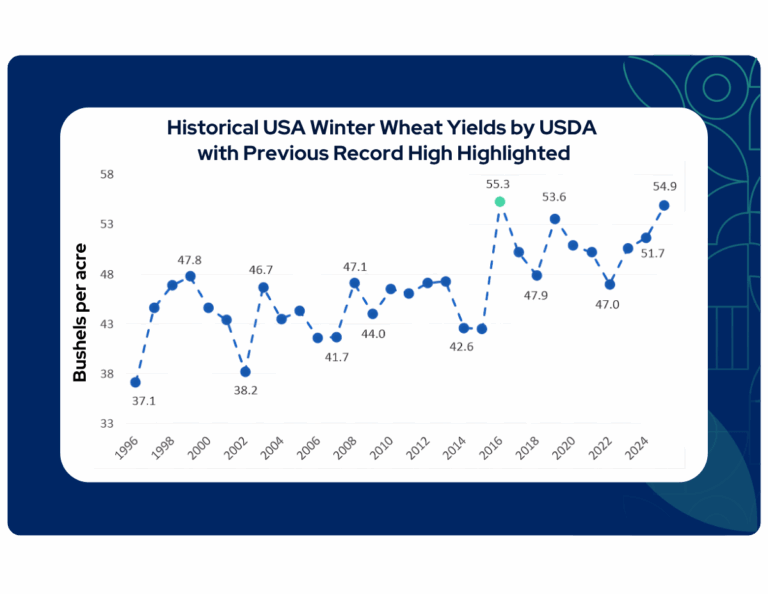
The chart illustrates historical USDA estimates of U.S. winter wheat yields, showing that the latest September 2025 estimate of 54.9 bushels/acre is the highest since 2016 (55.3 bushels/acre), and the second highest on record. This explains why USDA’s production estimate stands higher than Octopusbot’s data-driven assessment for the season.
USDA’s methodology relies primarily on grower surveys and NDVI data, which do not fully account for the wider economic landscape and underlying weather conditions impacting yields. Octopusbot’s AI forecasts are built on hundreds of interconnected models trained on historical yield patterns and weather parameters to generate a data-driven estimate. By integrating NDVI trends, crop condition scores, and prevailing weather data, the models indicate a lower wheat production estimate for the 2025/26 season compared with official estimates.
A similar adjustment occurred in the 2016/17 Small Grains Summary report, when USDA’s initial wheat production estimates were later revised downward after updated feed and residual use data and lower ending stock figures indicated that production had been overstated. The revision reflected lower winter wheat yields and reduced harvested area following updated field data. Consistent with historical patterns, any discrepancies in the 2025/26 season are likely to become evident in the January 2026 USDA report or through lower-than-expected ending stocks and feed and residual use reported in upcoming quarterly updates.
NDVI and Crop Conditions
The latest GEOGLAM Crop Monitor (September 2025) shows mixed NDVI patterns across U.S. winter wheat regions. Crop growth remains strong in Kansas, Oklahoma, and Texas, while Colorado and Montana display weaker vegetation. These mixed conditions point to a solid but not record-strong crop.
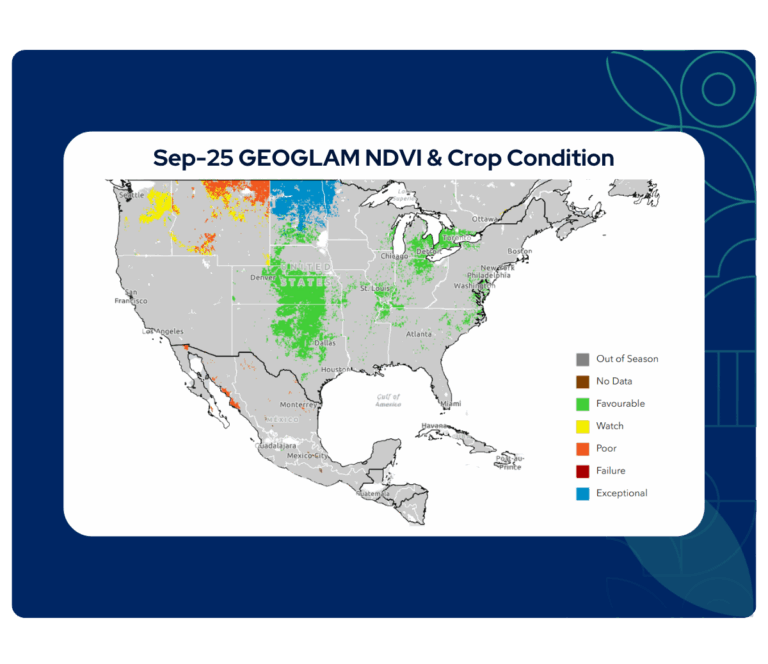
Additionally, in May 2025, Kansas and parts of Nebraska and eastern Colorado reported outbreaks of the wheat streak mosaic virus (WSMV). The virus, transmitted by the wheat curl mite, affected crop growth and kernel development during critical growth stages, resulting in yield reductions.
The latest USDA Crop Progress report supports Octopusbot’s assessment that yields are lower than USDA’s estimates. The winter wheat condition score ranks 12th of the last 24 years, below last year but above the five-year average, indicating a strong but not near-record crop for the 2025/26 season.
Persistent Financial Stress Among U.S. Farmers
Farmers across the U.S. have been under growing financial stress since 2022, as profits have tightened and debt levels continued to climb. Operating loan rates remain high at around 8% in major winter wheat producing states such as Kansas and Oklahoma, where many growers continue to face limited cash flow and debt rollover pressure. These financial pressures are influencing pushing some farmers to reduce planted area.
This prolonged financial strain provides essential context to the U.S. wheat landscape that Octopusbot monitors. While weather and yield performance remain primary drivers, economic pressures on growers add another layer of risk that could influence upcoming planting decisions, shaping production potential across future seasons.
Octopusbot U.S. Wheat Estimate
Octopusbot’s latest forecast for total U.S. wheat production in the 2025/26 season shows a slight upward revision from the previous estimate, driven by small gains in spring wheat areas. Despite this revision, Octopusbot’s estimate remains lower than USDA’s estimate.
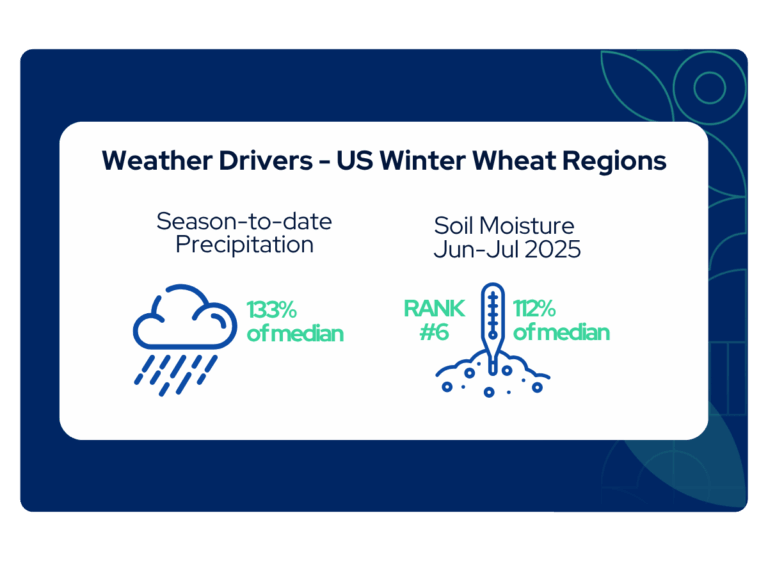
The difference primarily stems from USDA’s near-record winter wheat yield. Octopusbot’s AI-driven forecasts indicate lower yield potential, supported by the latest USDA winter wheat condition score, which sits below last year (98%) but above the five-year average (105%). This performance was supported by strong season-to-date precipitation at 133% of the median, indicating a strong but not near-record crop.
The key drivers impacting U.S. winter wheat production in the 2025/26 season are:
- Planted Area: Winter wheat planted area declined 0.5% year-on-year compared with the previous season.
- Precipitation: February – March recorded below-median rainfall (88% of the median) during key growth stages. Rainfall improved from May onward, bringing season-to-date precipitation to 133% of the median.
- Soil Moisture: Levels fell below the median in March (93% of the median) but recovered in subsequent months. Excessive soil moisture in June–July (112% of the median) in the winter wheat regions, particularly Kansas and Missouri, weighed down yields due to waterlogging during late grain fill.
- Temperature: Temperatures remained close to the median throughout the season, with no major heat or frost events recorded.
Octopusbot’s Forecast Accuracy
Octopusbot’s 2025/26 forecast reflects a data-grounded assessment of U.S. wheat production, supported by weather models and state-level crop condition scores that indicate a strong but not record crop. While USDA’s outlook points to near-record winter wheat yields, Octopusbot’s models, built on county-level weather data, vegetation trends, and historical yield data, provides a data-driven view of field performance that aligns more closely with crop conditions reported by farmers across key producing regions.
Over the past seasons, Octopusbot’s AI forecasts have demonstrated the ability to capture production trends ahead of official estimates, helping industry stakeholders interpret evolving crop conditions and anticipate changes in supply outlook with confidence. In January 2024, Octopusbot predicted the season’s production trend for wheat within 95% accuracy range, 10 months before the final estimate and 6 months before USDA, with a difference of 0.6% on the final estimate.
By combining accuracy with timeliness, Octopusbot continues to empower market participants to maximize profits with accuracy, mitigate risks with confidence, make smarter data-driven decisions, and stay informed with regional and global coverage delivering actionable production intelligence trusted across the agricultural value chain.
Comments are closed