
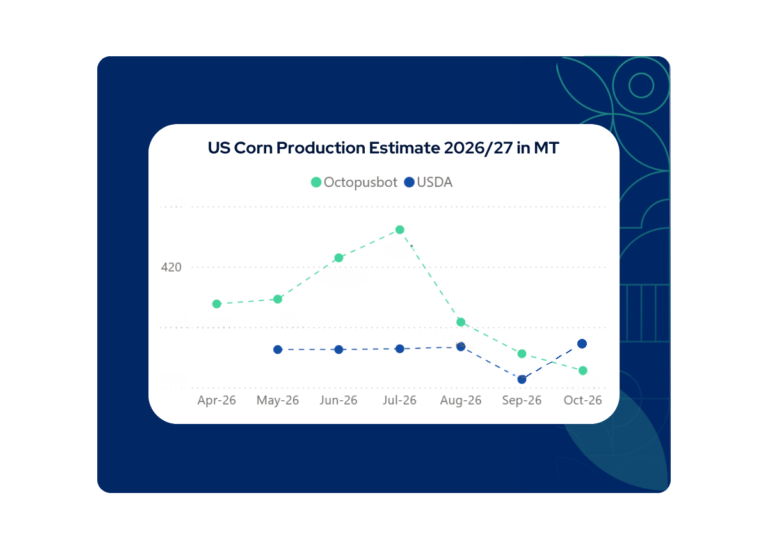
USDA surprised the market with its latest October release by increasing its US corn production estimate to 407.3MT from 401.3MT in September, coming in well above what the market and analysts expected. Corn futures fell sharply following the release.
Octopusbot’s models estimate a smaller crop. The latest production estimate was revised 0.7% lower compared to the previous estimate and now sits 1.1% below USDA, as the models quantified the impact of a much drier and hotter September during the final stages of grain fill and maturity. Rainfall, soil moisture, temperature and satellite data at the county level all point to weaker late-season yield potential across several major producing regions.
What Is Driving Octopusbot’s Lower US Corn Estimate?
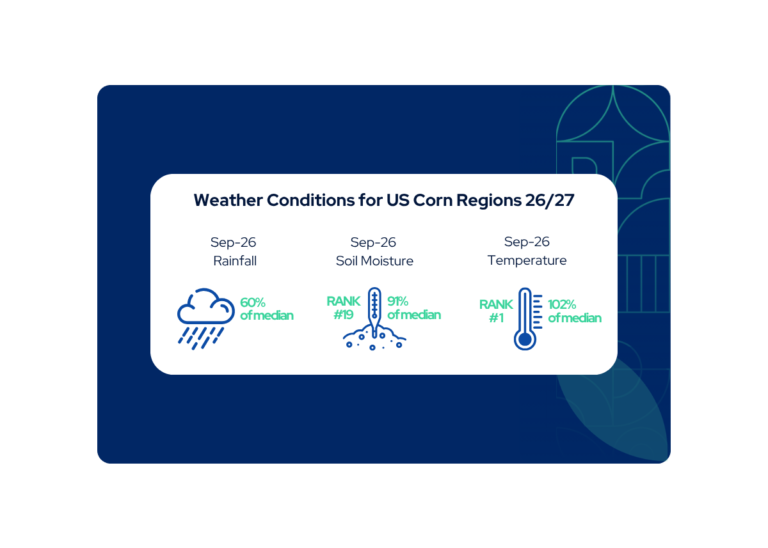
September delivered a much drier finish than expected. Rainfall across US corn regions recorded 60% of the median, against a forecast of 129% in the previous update, with the largest deficits across the Plains and the South.
Soil moisture declined to 91% of the median nationally, while Kansas, Missouri, Texas, Tennessee and Arkansas recorded their driest September soil moisture conditions of the last 27 years. Temperatures added further pressure, with September recording the highest temperatures of the last 26 years across US corn regions. These conditions developed as the crop completed grain fill and moved into maturity, reducing late-season yield potential ahead of harvest.
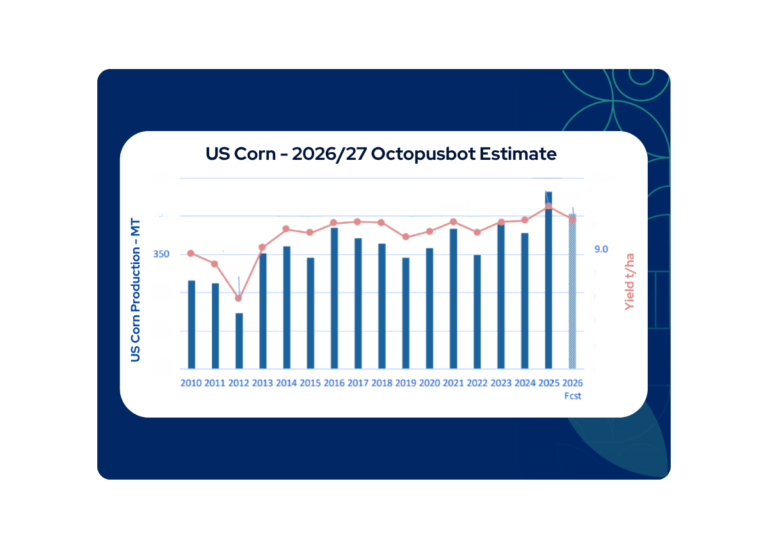
Planted area is estimated to be 2% below last year. Despite the late-season reduction, US corn yields are estimated at the second-highest on record. Favourable soil moisture at sowing and generally favourable rainfall from April through August supported strong yield potential through much of the season, later reduced by July heat during pollination and the dry finish in September. USDA corn condition ratings also remained below last year and the five-year average, ranking #8 of the last 12 years.
Where were the Largest Yield Reductions?
The Plains and the South recorded some of the sharpest September moisture deficits. Across the Plains, September rainfall recorded 43% of the median in Nebraska and 50% in Kansas. Soil moisture declined to 81% of the median in Nebraska and 78% in Kansas, with Kansas recording its driest September soil moisture of the last 27 years.
Octopusbot’s yield models quantified the largest reductions across the Plains. Nebraska and Kansas, which together account for 17% of US corn planted area, recorded large yield-driven reductions, supported by weaker satellite signals and widening the gap with USDA’s latest estimates.
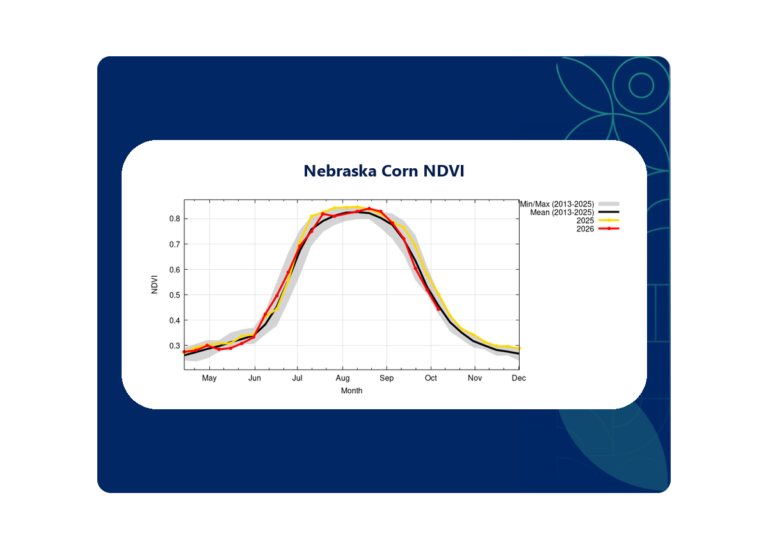
In Nebraska, the hot, dry September accelerated crop maturity and shortened the grain-fill period. Yields are estimated 9.2% below last year and 2.8% below the 5-year average. Corn NDVI for 2026 (red line) moved below last year (yellow line) and the historical mean (black line) from mid-September, consistent with below-median rainfall and declining soil moisture.
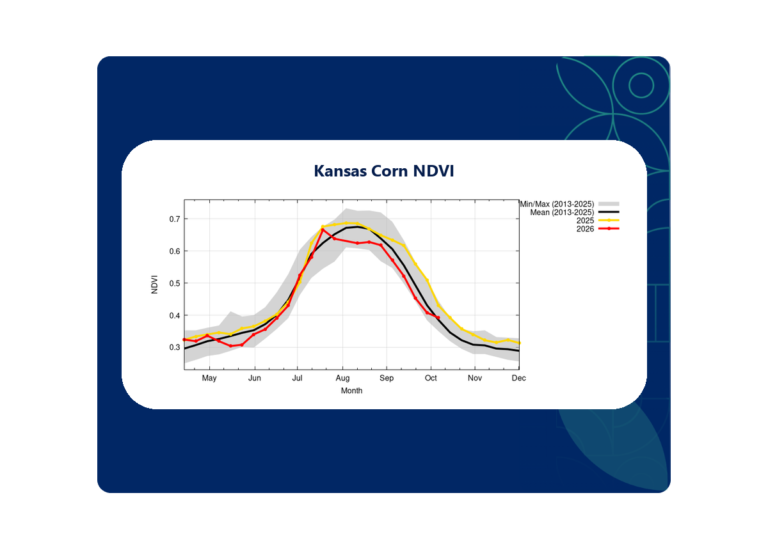
Kansas showed a longer deterioration beginning with July heat and continuing through the dry September finish. Yields are estimated 17.4% below last year and 3.2% below the 5-year average, with NDVI declining from late July to move below last year and the historical mean through grain fill.
What does this mean for the US Corn Market?
Octopusbot’s lower production estimate points to a smaller US corn crop than USDA currently forecasts, which would imply tighter supply than the market is pricing from USDA’s latest estimate.
Demand presents a different picture. Octopusbot’s latest consumption estimates quantify US corn feed use 10.8% below USDA, as cattle numbers remain tight and ethanol by-products replace more corn in feed rations. Lower feed demand indicates higher US corn ending stocks than USDA, creating a potentially bearish outlook for US corn prices.
Octopusbot Past Forecast Accuracy
Octopusbot’s models have consistently demonstrated strong forecast accuracy across US grain and oilseed markets, combining hundreds of weather parameters with historical yields at the county level to quantify production shifts early and accurately, well ahead of official estimates.
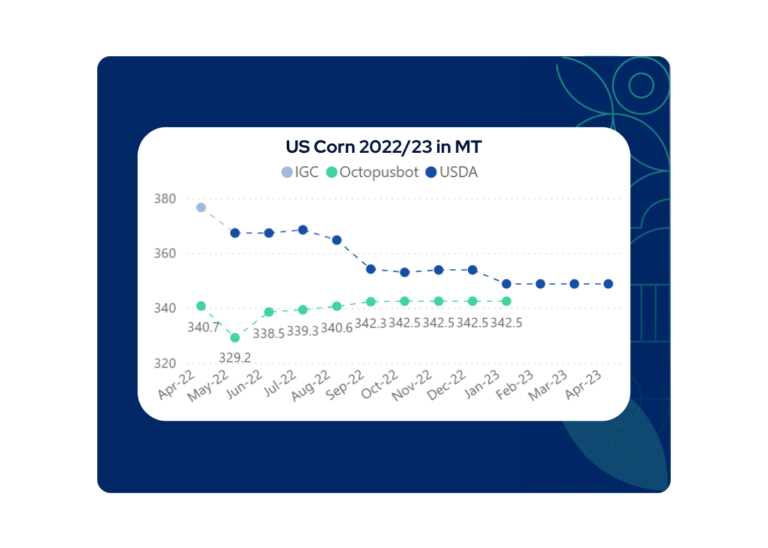
In April 2022, Octopusbot predicted that the season’s production would trend lower for US corn, 9 months ahead of USDA’s prediction, with a difference of only 1.8% on the final estimate.
Octopusbot empowers growers, grain traders, brokers, and agribusinesses globally with trusted forecasts that quantify production risks and shifts early in the season. By removing market noise and bias, Octopusbot’s trusted forecasts help market participants plan ahead with confidence, trade at the right price, make data-driven decisions, and gain an edge to improve income.
 For full, detailed AI forecasts on Argentina wheat, barley, corn, soybean & more:
Comments are closed