

The USDA’s first official production estimate for the 2026/27 U.S. wheat season is the lowest opening forecast on record. The implied combination of the lowest planted area in history, near record abandonment, and weak winter wheat yields is a scenario without a clear historical parallel.
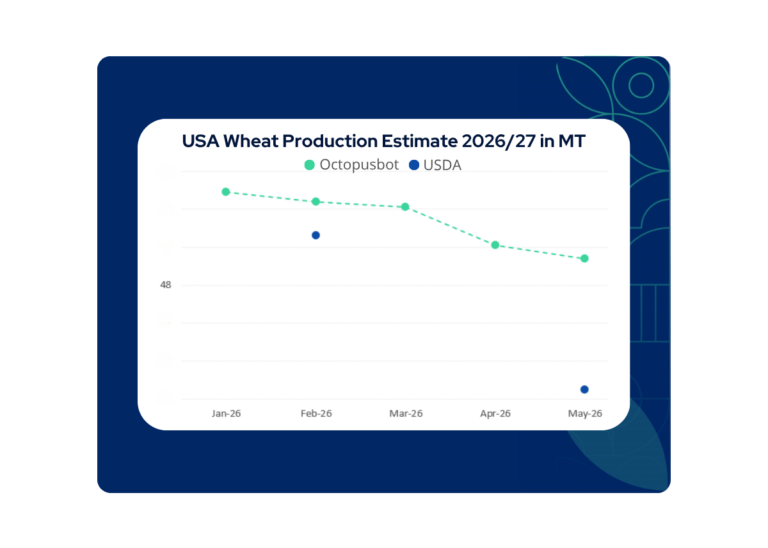
Octopusbot’s latest estimate is 16% above the USDA’s total estimate, with a larger gap in winter wheat (~20%) and a smaller gap in spring wheat (~8%). The estimate has been revised lower over recent months as actual precipitation tracked well below seasonal forecast expectations, but the on-ground data does not support the extreme assumptions the USDA is predicting, particularly on abandonment.
This blog examines how Octopusbot’s models quantify the impact of abandonment, precipitation, soil moisture, and frost risks on yields across the crop cycle, and how these factors are shaping the latest estimates. It also looks at USDA’s historically extreme opening outlook and the assumptions driving the largest gap between Octopusbot and USDA in recent years.
USDA’s Historically Extreme Opening Release for Season 2026/27
USDA has released its first crop estimates for the 2026/27 season, and the U.S. wheat estimate came as a significant surprise. The opening forecast combines the lowest planted area in history with 43.8 million planted acres (~17.7 Mha) and only 32.9 million harvested acres (~13.3 Mha), implying a ~25% national abandonment rate and 32% abandonment for winter wheat alone, levels comparable to the 2023 season. On top of that, winter wheat yields are also forecast below 2023 levels.
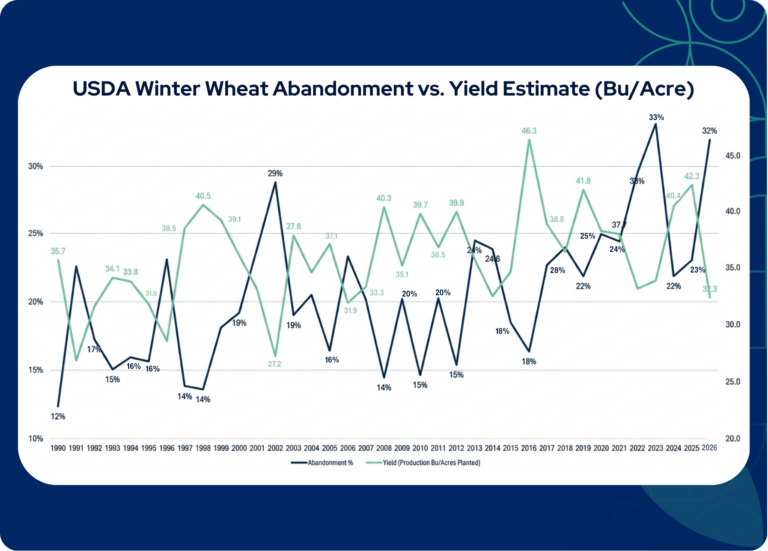
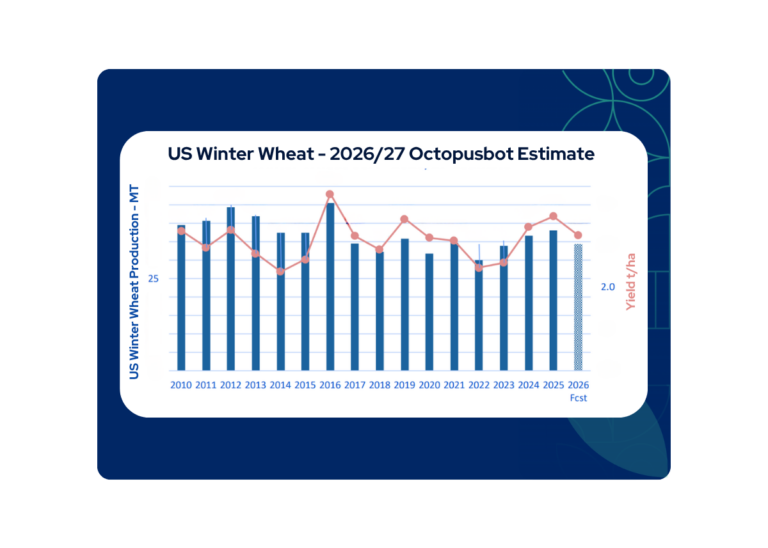
The divergence with Octopusbot’s estimates is most significant in winter wheat, where USDA’s opening estimate implies a winter wheat abandonment rate near 32%, equivalent to approximately 10.4 million abandoned acres (~4.2Mha). Octopusbot’s abandonment AI models estimate 22.3% abandonment rate for winter wheat, well below USDA’s implied 32%, based on Octopusbot’s higher winter wheat yield estimates driven by a positive June-August rainfall outlook (~134% of the median rainfall forecast). As the chart below shows, USDA’s 2026/27 opening estimate combines one of the highest winter wheat abandonment rates on record with winter wheat yields near historical lows at 32.3 bu/acre (~2.17 t/ha).
Adding to the uncertainty, NASS’s March 2026 Prospective Plantings survey recorded a 37.6% farmer response rate, the lowest in the survey’s history. Lower participation increases uncertainty around harvested area estimates, particularly across the Plains where abandonment assumptions are most sensitive.
USDA May Estimates: A Historically Bearish Starting Point
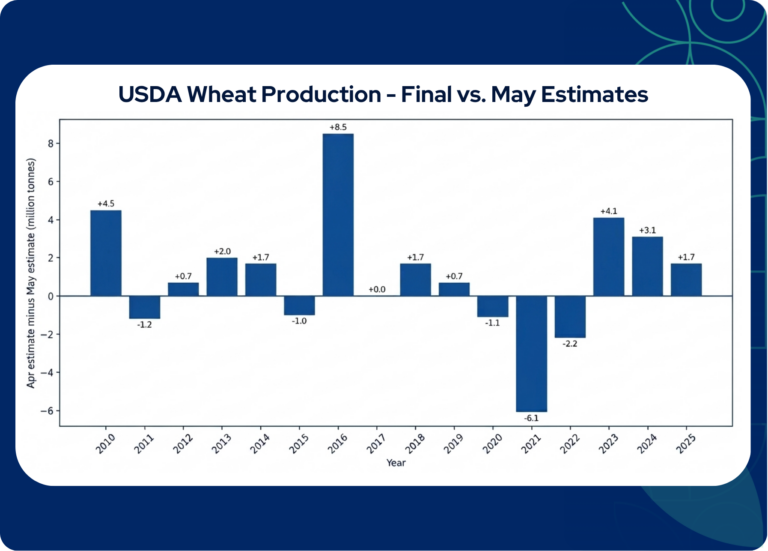
USDA’s May estimate has historically undergone significant revisions through the season. As the chart below shows, in 10 of the last 16 years the final production estimate came in above the May release, meaning USDA underestimated production at the opening of the season more often than not. The largest corrections were recorded in 2016 (+8.5MT), 2010 (+4.5MT), 2023 (+4.1MT), and 2024 (+3.1MT).
This pattern reflects the inherent difficulty of estimating production before the critical grain-filling window closes, with survey data collected at a point of maximum uncertainty on abandonment and yield potential. Given that the 2026/27 opening estimate is projecting historically extreme assumptions across planted area, abandonment, and yields simultaneously, the probability that USDA has again underestimated production is a key factor the market will be watching closely.
Behind the Frost Headlines: Octopusbot’s Models Quantified No Yield Impacts
There has been significant market noise around frost events and cold snaps impacting winter wheat yields this season. However, the data tells a different story. Octopusbot’s yield models tracked and quantified freeze exposure across the January to March period, recording a below-median number of freeze days across key winter wheat regions, with severe cold degree-days below -20°C remaining low relative to historical extremes throughout the winter wheat belt. No winterkill signal was identified from temperature data alone.
While frost captured significant market attention through the winter months, Octopusbot’s models identified early that the depth, duration, and exposure of freeze events across the winter wheat belt did not meet the threshold for negative yield impact, separating seasonal noise from yield-driven signals.
These NDVI trends confirm that satellite data is aligned with Octopusbot’s model forecasts, supporting the projection of a strong Russia wheat crop for the 2026/27 season.
What Is Driving the Gap Between Octopusbot and USDA
Octopusbot’s latest total U.S. wheat production estimate sits approximately 16% above USDA, with the divergence most significant in winter wheat at approximately 20% above USDA’s estimate.
Octopusbot’s estimates have been revised lower over the past three months, primarily due to actual precipitation across key winter wheat regions tracking approximately 30% below seasonal forecasts, reducing winter wheat yield estimate by approximately 6% since Octopusbot’s first release in January. Localised mid-season dryness has contributed to incremental downward revisions, though the impact remains well below the levels USDA is projecting.
The market’s focus has centred heavily on USDA NASS crop progress data, which shows national winter wheat condition at a historical low of 28% good to excellent, similar to 2022 and 2023 ratings of 29%. In 2022, those conditions corresponded to winter wheat yields of 2.23 t/ha. Octopusbot’s models, however, estimate the latest winter wheat yields approximately 17% above that level, supported by a favourable June to August precipitation outlook, which is not fully reflected in current crop condition ratings.
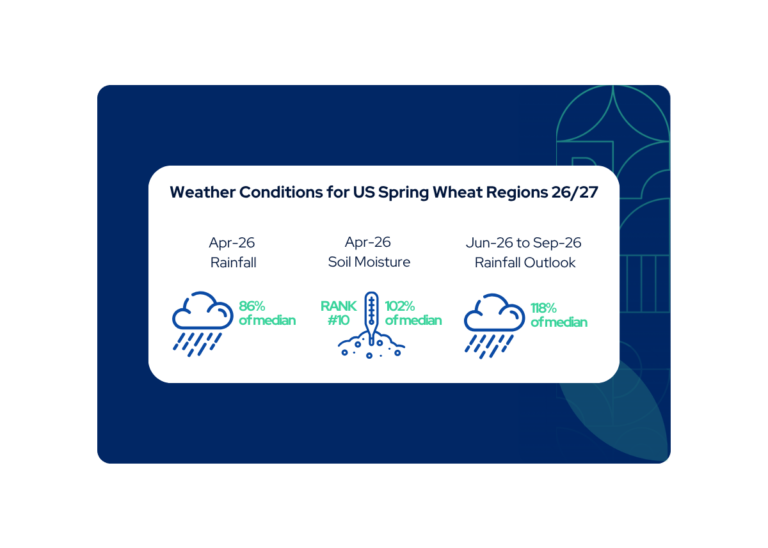
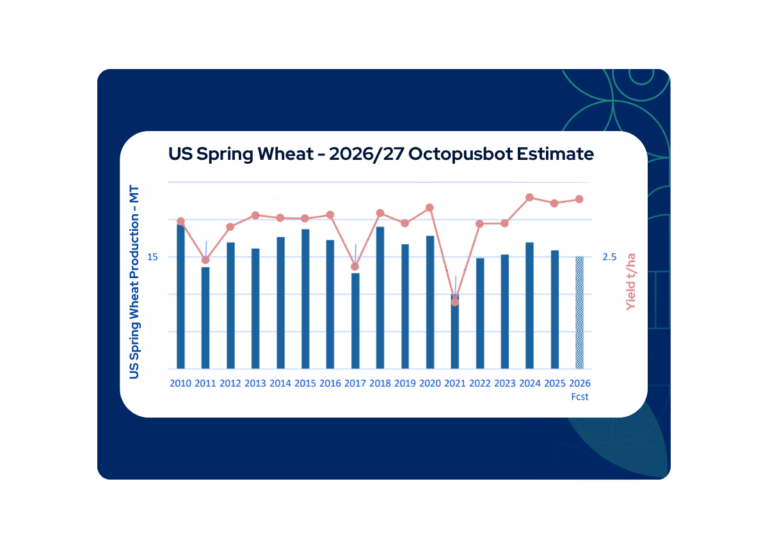
Spring wheat accounts for approximately 30% of total U.S. wheat production, and with that significant share still to be determined, the question of whether the overall crop finishes as poor as USDA projects remains questionable. Octopusbot’s latest spring wheat estimate sits approximately 8% above USDA, supported by above-median soil moisture during planting (102%) and a strong June to September precipitation outlook (~118% of the median), suggesting spring wheat could provide crucial support to total U.S. wheat production relative to current market expectations.
If actual precipitation continues converting at approximately 30% below seasonal forecasts, the most probable outcome sits around the midpoint between Octopusbot’s latest estimate and USDA, with the USDA opening estimate representing the downside scenario, requiring both winter and spring wheat conditions to deteriorate further from here.
Octopusbot’s Latest U.S. Wheat Production Estimate
Octopusbot’s latest U.S. wheat production estimate for the 2026/27 season was revised lower compared with the previous update, driven by below-forecast April 2026 precipitation across winter wheat regions and persistent soil moisture deficits in key West North Central states, particularly Kansas and Nebraska. Winter wheat accounted for the majority of the downward revision, while spring wheat was revised lower by a smaller amount due to soil moisture deficits in South Dakota and Idaho during sowing. State-level reductions were concentrated in South Dakota, Texas, and Kansas, partially offset by an increase in Montana. Despite these downward revisions, Octopusbot’s latest estimate sits approximately 16% above USDA’s opening release for the 2026/27 season.
The key drivers impacting the latest production estimate are:
Winter Wheat
- Planted Area: Winter wheat planted area is estimated 2.2% lower year-on-year.
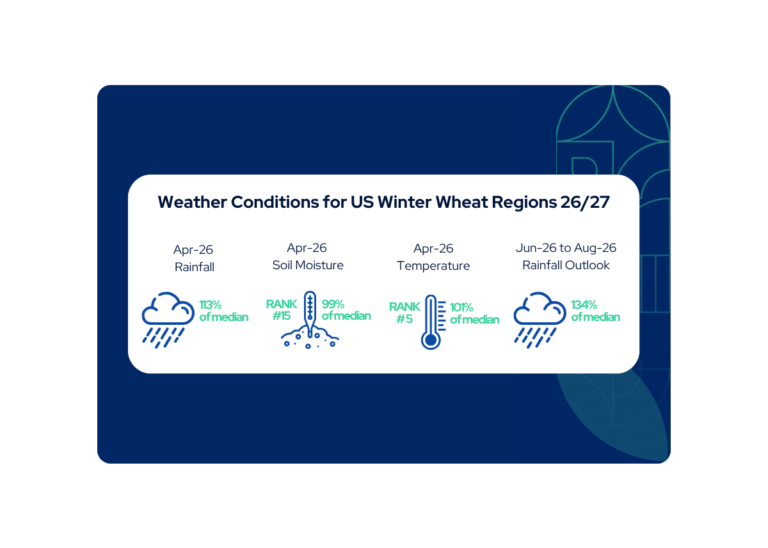
- Precipitation: April 2026 recorded above-median precipitation at 113% of median, below the 130% forecast. The May outlook is below median at 90%.
- Soil Moisture: Improved to 99% of median in April, up from 89% in March. Severe deficits persist in Nebraska, Kentucky, North Carolina, Tennessee, and Maryland.
- Temperatures: April 2026 recorded above-median temperatures, ranking #5 warmest of the last 26 years.
- Precipitation Outlook: Rainfall forecast above median from June to August (~134% of median).
Spring Wheat
- Planted Area: Spring wheat planted area is estimated 6.7% lower year-on-year.
- Precipitation: April 2026 recorded below-median rainfall at 86% of median. The May outlook is below median at 66%.
- Soil Moisture: Above-median nationally at 102%. Severe deficits persist in South Dakota and Idaho, ranking #23 and #22 driest of the last 26 years respectively.
- Precipitation Outlook: Rainfall forecast above median from June to September (~118% of median).
Winter wheat yields are estimated below last year and above the five-year average, mainly driven by lower-than-forecast April precipitation and below-median soil moisture across key producing regions, partially offset by above-median rainfall forecast from June to August (134%).
Spring wheat yields are estimated above last year and well above the five-year average, supported by above-median soil moisture during planting and favourable rainfall forecast from June to September (118%). Below-median soil moisture in South Dakota and Idaho has contributed to a small downward revision from the previous estimate.
Octopusbot’s yield projections across winter and spring wheat sit well above the levels implied by USDA’s first estimate, reflecting a more data-driven assessment of how abandonment, soil moisture, and the seasonal precipitation outlook are likely to impact production. How much of the gap between the two estimates closes will depend on whether seasonal forecasts convert through the remainder of the season.
Octopusbot Past Forecast Accuracy
Octopusbot’s models have consistently demonstrated strong forecast accuracy across U.S. wheat markets by quantifying the impact of weather conditions on production well ahead of traditional agencies. Octopusbot’s models combine hundreds of weather parameters with historical yields at the regional level to generate accurate forecasts for the season. These models also incorporate seasonal developments throughout the crop cycle to quantify yield-driven production shifts early and accurately.
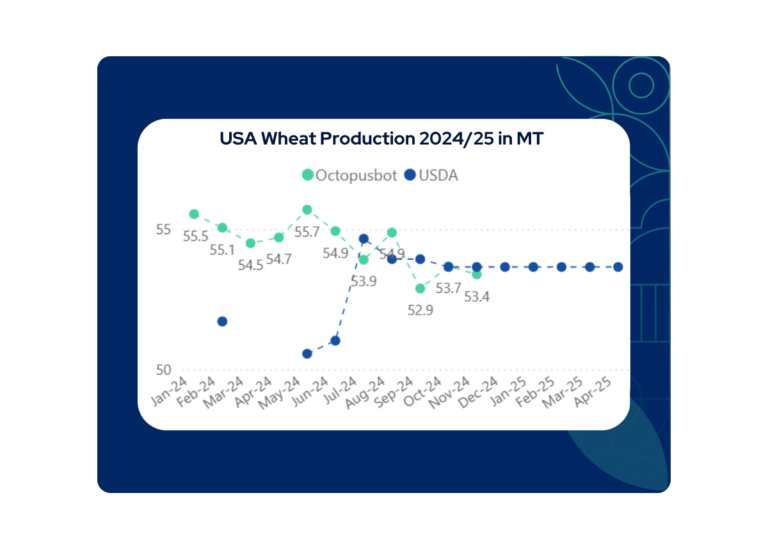
In January 2024, Octopusbot predicted the season’s production trend for U.S. wheat within 95% accuracy range, 10 months before the final estimate and 6 months before USDA, with a difference of 0.6% on the final estimate.
Octopusbot empowers growers, grain traders, brokers, and agribusinesses globally with trusted forecasts that quantify production risks and shifts early in the season, before they are fully reflected in official estimates or market pricing. By removing market noise and bias and focusing on weather-driven yield outcomes, Octopusbot’s trusted forecasts help market participants plan ahead with confidence, trade at the right price, make confident, data-driven decisions, and gain an edge to improve income.
 For full, detailed AI forecasts on US wheat, corn, soybean & more:
Comments are closed